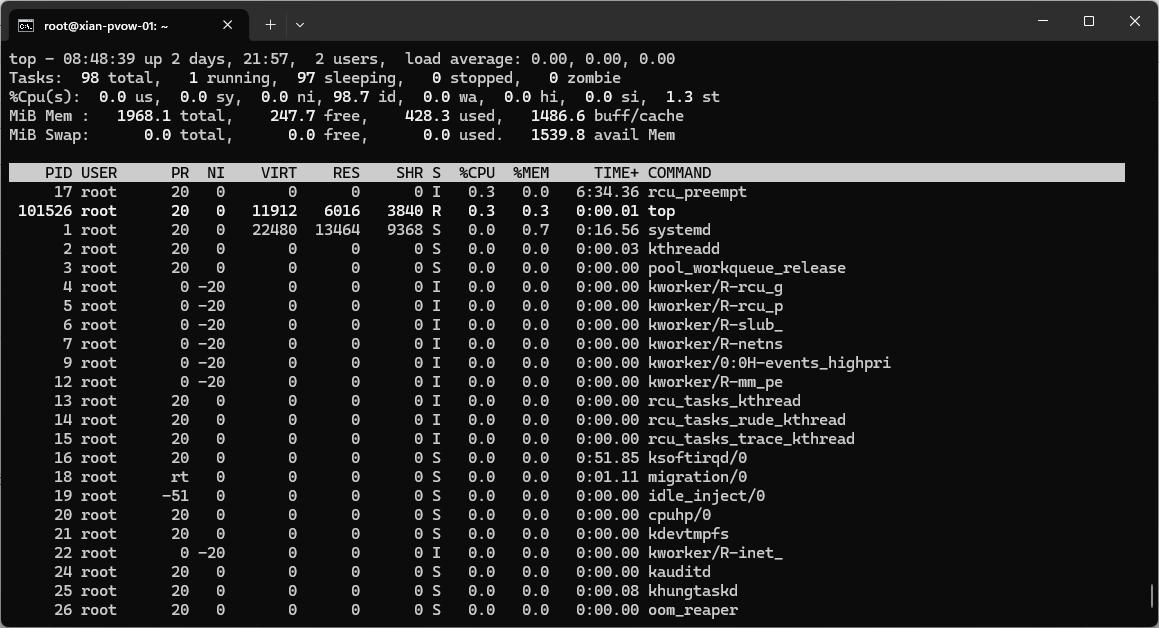
The top command provides real-time insights into your system's performance, displaying CPU, memory, and process statistics.
top
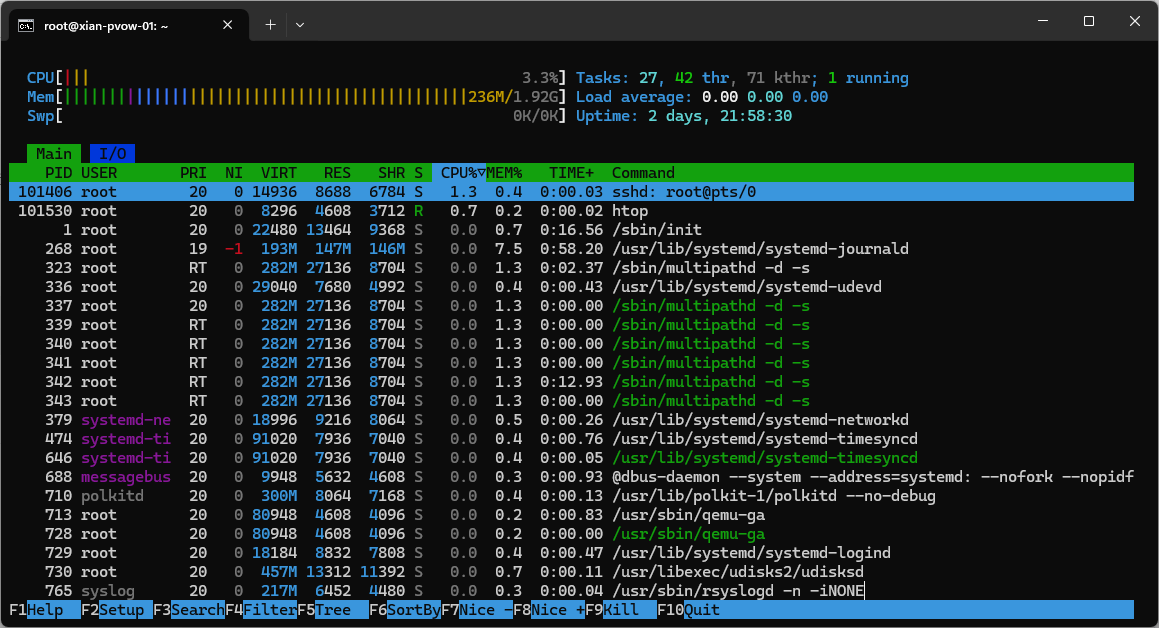
htop provides a user-friendly interface with color-coded statistics, making system monitoring easier.
sudo apt install htop   # For Debian/Ubuntu
sudo yum install htop   # For CentOS/RHEL
htop
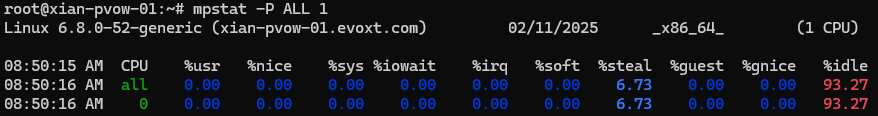
mpstat monitors CPU performance across all cores, providing per-core statistics and overall usage.
sudo apt install sysstat  # Debian/Ubuntu
sudo yum install sysstat  # CentOS/RHEL
mpstat -P ALL
The uptime command quickly shows system load and uptime.
uptime
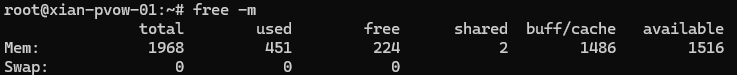
The free command displays total, used, and available memory along with swap usage.
free -m
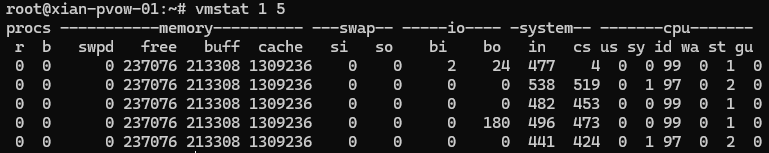
vmstat provides detailed statistics for memory and I/O operations.
vmstat 1 5
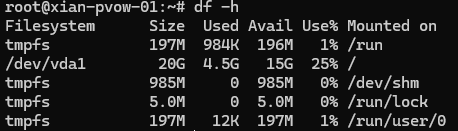
Check available disk space with df in a human-readable format.
df -h
Monitor disk I/O performance using iostat.
iostat -dx 1

Identify large files using the du command.
du -ahx / | sort -rh | head -10

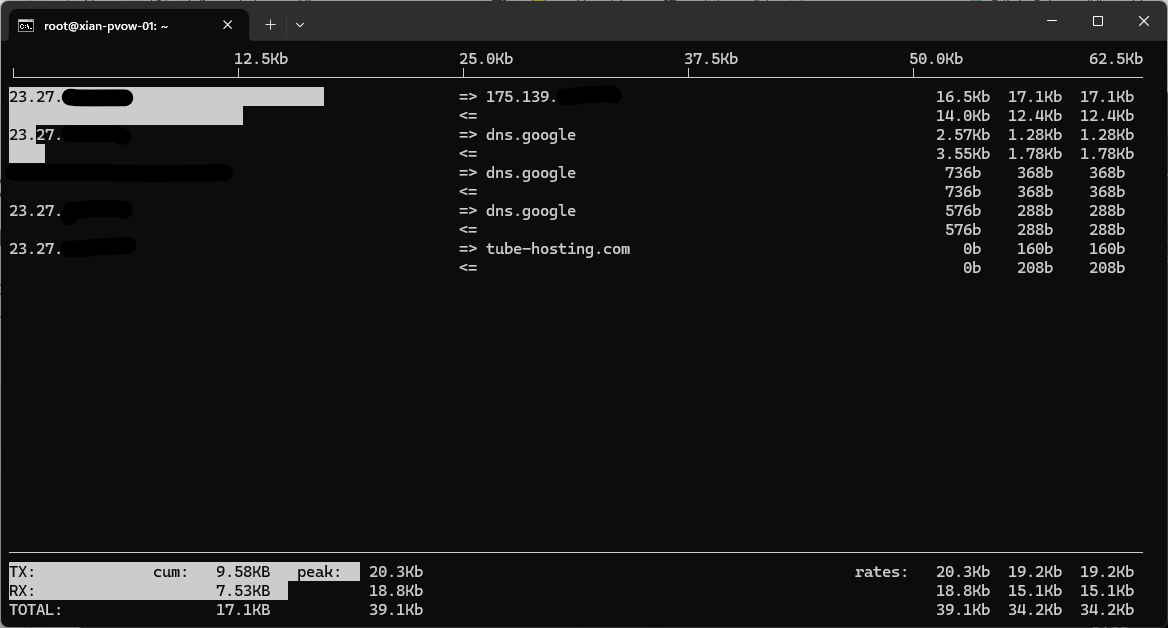
iftop tracks network usage and bandwidth to help identify bottlenecks.
sudo apt install iftop  # Debian/Ubuntu
sudo yum install iftop  # CentOS/RHEL
sudo iftop
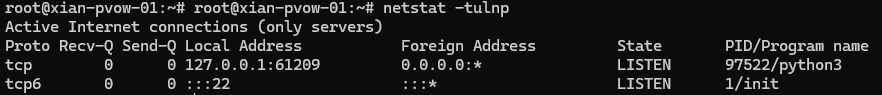
View active network connections using netstat or ss.
netstat -tulnp
ss -tulnp

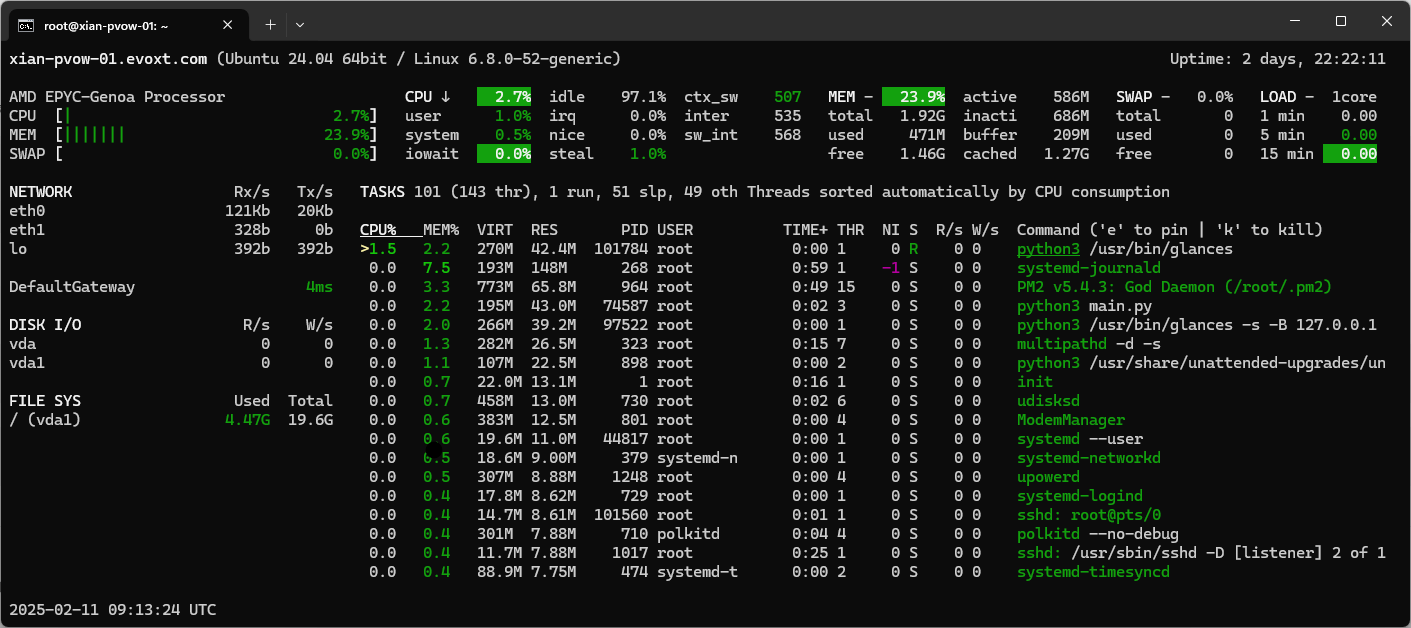
Glances offers a comprehensive overview of system resources, complementing your monitoring toolkit.
sudo apt install glances  # Debian/Ubuntu
sudo yum install glances  # CentOS/RHEL
glances