Experiencing slow network performance or connectivity issues between your Evoxt VPS and local device? This guide explains how to use MTR and Traceroute to diagnose packet loss, latency, and network bottlenecks. Follow these step-by-step instructions to analyze network routes, detect congestion, and improve connectivity between your VM and local device.
Using Traceroute for Network Diagnosis
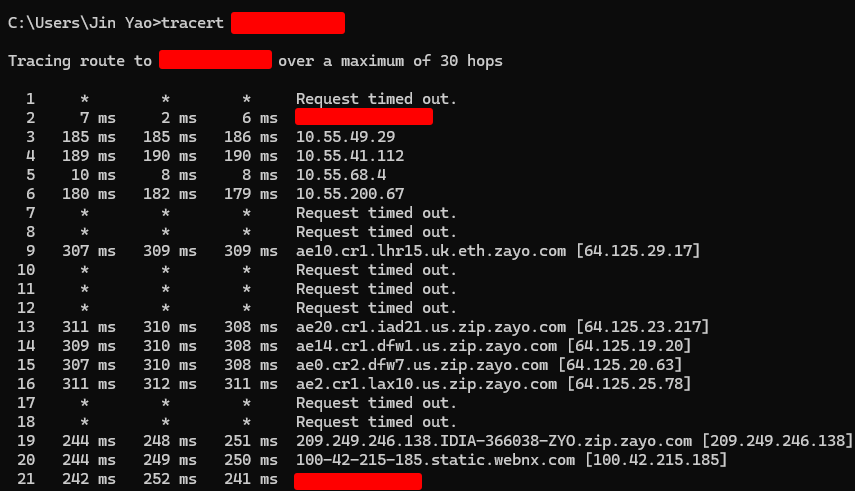
Traceroute is a tool that maps the path your packets take to reach the destination. It displays each "hop" (router) along the path and provides latency information for each hop.
Traceroute on Windows
Open Command Prompt (Press Win + R, type cmd, then press Enter).
- Run the command:
tracert [IP]
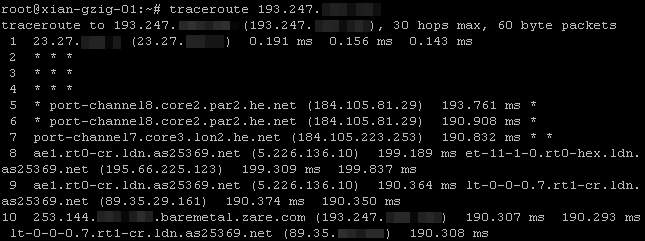
Traceroute on Linux
If traceroute is not installed, install it using:
Ubuntu/Debian:
sudo apt install traceroute
CentOS/Rocky:
sudo yum install traceroute
- Run the command:
traceroute [IP]
How to Read Traceroute Output
- Each hop represents a router between your Windows PC and your VM.oi
- Large jumps in response time (ms) indicate network congestion.
- If you see
* * * → The hop did not respond (it may be blocking ICMP packets).
Using MTR for Network Diagnosis on Evoxt VPS
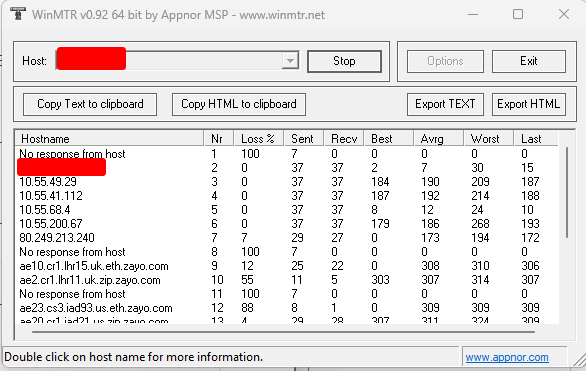
WinMTR on Windows
Since MTR is not built into Windows, you need to install WinMTR:
Download WinMTR.
Extract the ZIP file.
Open WinMTR.exe (for 32-bit) or WinMTR64.exe (for 64-bit).
Enter the IP address in the "Host" field and click Start to begin tracing.
MTR on Linux
If MTR is not installed on your Linux system, install it using the following command:
Ubuntu/Debian:
sudo apt install mtr
CentOS/Rocky:
sudo yum install mtr
- Once installed, run MTR with the command below to test connectivity to your VPS:
mtr [IP]
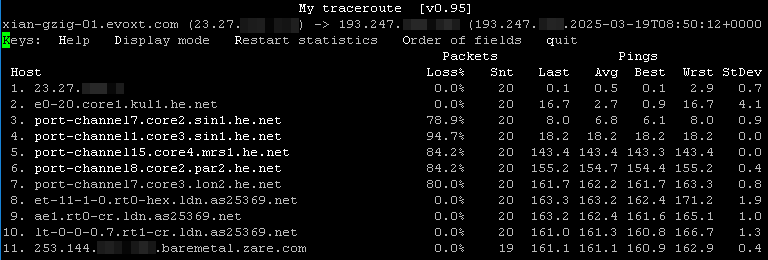
Understanding WinMTR Output
- Loss% → Packet loss at each hop. High loss suggests network issues.
- Snt → Number of packets sent.
- Last → Time (ms) for the last packet to reach that hop.
- Avg → Average latency over time.
- Best/Worst → Minimum and maximum latency recorded.
- StDev → Latency fluctuation over multiple tests.
Common Traceroute and MTR Issues
Why is the First Hop "Request Timed Out"?
- Your router or ISP might block ICMP requests for security reasons.
- This does not affect normal internet traffic, only diagnostic tools.
Why is the Last Hop Not My Target IP?
- Load balancers or CDNs may route traffic through different IPs.
- Some servers block ICMP requests, causing them to not appear in results.
- Asymmetric routing may cause different paths for incoming and outgoing traffic.
Why Do I See Packet Loss in the Middle of the Route?
- If intermediate hops show packet loss but the final destination does not, it may be ICMP rate limiting, not an actual issue.
- If loss continues to the last hop, there is a genuine problem with the network.
Using
WinMTR and
Traceroute helps identify network problems such as
packet loss, high latency, and routing issues between your local device and
Evoxt VPS. If you notice
persistent packet loss or
unusual latency,
contact Evoxt support for further troubleshooting.

